Welcome to the Tech Savvy Teacher! Technology is one of the best resources we have in the classroom, knowing how and when to use it is essential. This week in class we began working on the 6th grade science standard 1 objective 1 which entails describing the changes in the appearance of the moon during a month. To allow the students to observe these changes during school we will be using Google Earth. We will be able to observe the moon during each day of the 28-day cycle and measure the change each day.
Before beginning this project I first described the length of the cycle and introduced each of the phases of the moon (waxing crescent, 1st quarter, waxing gibbous, full, waning gibbous, last quarter, and waning crescent). Once students have a basic understanding of each of the phases it is time to use Google Earth. Students can complete this project either in groups or individually. On the first day have the students open Google Earth select the planet icon to switch from earth to sky. Once they have selected “Sky” search for the Moon.
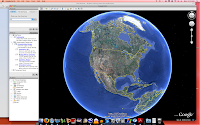
Above: The beginning screen upon opening the program.
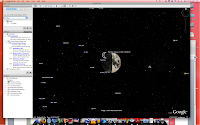
Below: Select the planet icon and search for the Moon.
To zoom in on the moon use the “+ and –“ bar on the right side of the screen. Each day of the cycle the students will observe the appearance of the moon and then use the ruler tool to measure how much of the moon is visible that day. To do this, select the ruler icon at the top of the screen, the screen should appear like the one below.
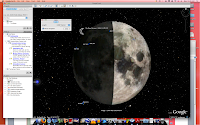

Above: Measuring the width of the moon.
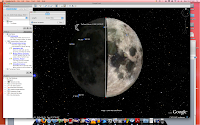
Below: Measuring the moon from top to bottom.
The students will work on this project over one month to track the progress. The students will fill in a chart daily listing the date, the amount of the moon that is showing, a sketch, and the phase of the moon. Using Google Earth students will be able to use technology to observe the appearance of the moon during each of the phases without having to go outside each night. This program is a great way to get students involved in their own learning and excited about our solar system!